
In today’s blog post I will be going over another interesting question that was posted on the Power BI Community forum. This question relates to comparing a selected client with other Top N clients. Of course, this same problem and solution can be applied to any other values you want to compare that are contained in your slicer!
If you haven’t joined the Power BI Community forum, I would highly recommend doing so. As part of the community, you can share your knowledge, learn from others, and get advice and input relating to your Power BI questions and challenges. There are a lot of amazing and intelligent community members who will help in providing you with an effective solution. I’ve mentioned the community many times before, but I really can’t say enough about it! I’ve learned so much from the community through both reading others’ solutions and coming up with my own solutions to various questions.
For this particular post, I came up with a solution to one of the questions on the forum and thought it would be helpful to share the solution with everyone through a blog post. I hope you learn something from this post and are able to tweak the solution, if needed, to meet your visualization needs.
Problem – How do you compare a selected client with other Top N clients?
Let’s first understand the problem. So, the ask was to compare a selected client with other Top N clients based on their rank (which, in turn, is based on volume). Top N is not a fixed value; the user wanted to dynamically select the Top N clients for comparison (3, 5, 10, etc., essentially any number).
On top of the above question, as a bonus, I thought it might be nice to always show the selected client as the first client in the visual and to show the remaining clients based on rank.
Here is some sample data:
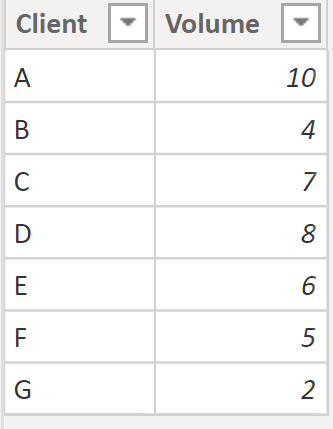
Solution:
Let’s go through the solution now!
To achieve the solution, we need to create a disconnected Client table for the slicer. This can easily be done using Power Query or DAX; I created this table using the following DAX formula.
Client = VALUES ( 'Table'[Client] ) //create table for distinct client values and this will be used in slicerAfter our Client table for the slicer is ready, we just need to add some measures to achieve the final output.
Sum Volume = SUM ( 'Table'[Volume] ) //just simple measure to sum the volume

Rank =
VAR __selectedClient = SELECTEDVALUE ( Client[Client] ) //check current selected client from the slicer
VAR __rank = //rank the client
IF (
    MAX ( 'Table'[Client] ) == __selectedClient, 0, //if it is a selected count rank it as a zero
    RANKX (
        FILTER ( ALL ( 'Table'[Client] ), 'Table'[Client] <> __selectedClient ),
        [Sum Volume], ,
        DESC, Dense
    )
)
RETURN
    __rank
In this measure, whichever client is selected is given a rank value of 0. Other clients are ranked based on their volume. In the image below, you can see that whichever client is selected in the slicer is always has a rank value of 0, and the others are ranked based on their volume (see the highlighted section in the table below).
I also added a what-if parameter called “Top N Client,” which allows us to select how many Top N clients we want to show in the visual alongside the selected client.
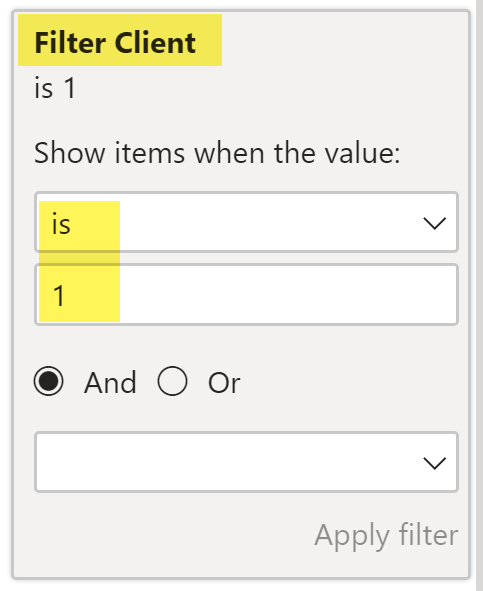
Another measure we need is to filter for Top N clients. This is a simple measure to check if the rank of the client is less than or equal to the selected value in the what-if parameter. If it is, we want to return a value of 1 (meaning we show this client), otherwise, we want to return a value of 0 (meaning we exclude this client). We will use this for a visual level filter where the value is 1.
//flag which client to filer based on number of clients selected on what-if parameter
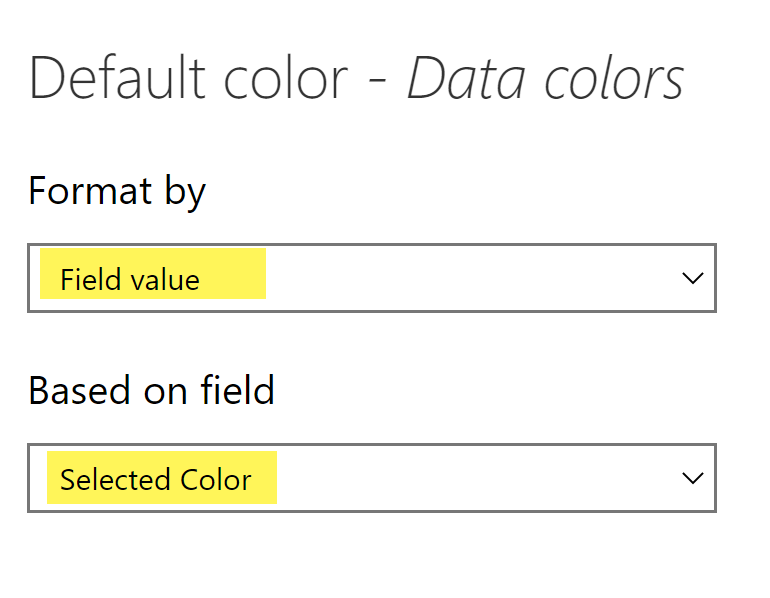
Filter Client = IF ( [Rank] <= [Top N Client Value], 1, 0 )I also added one more measure called Selected Color to give a different colour for the selected client in the slicer. This is simply achieved by using the following measure, and then this measure is further used in conditional formatting.
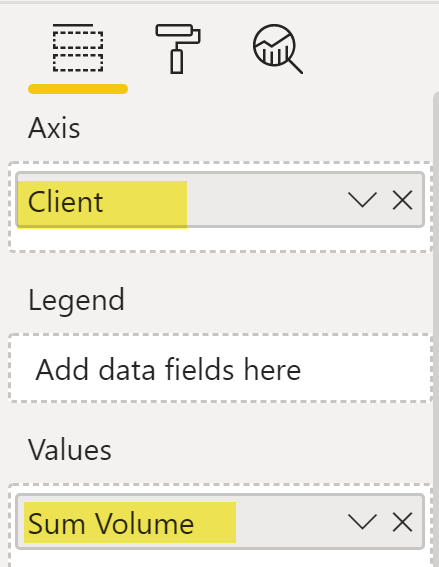
Selected Color = IF ( MAX ( 'Table'[Client] ) = SELECTEDVALUE ( Client[Client] ), "#E1C233" )Once all the above measures are complete, it’s now time to visualize the data. To do this, just add a column chart and on the X-Axis we have a Client column and on the value section, we have the Sum Volume measure (Image 1). We use the Filter Client measure for the visual level filter (Image 2) and we also use conditional formatting to ensure that the selected client is shown in the colour yellow (Image 3)
Finished Product – Comparing Selected Client With Top N Clients
And once the above is all done, we finally have our output.
Bonus – Sort the Selected Client and Top N Clients by Rank:
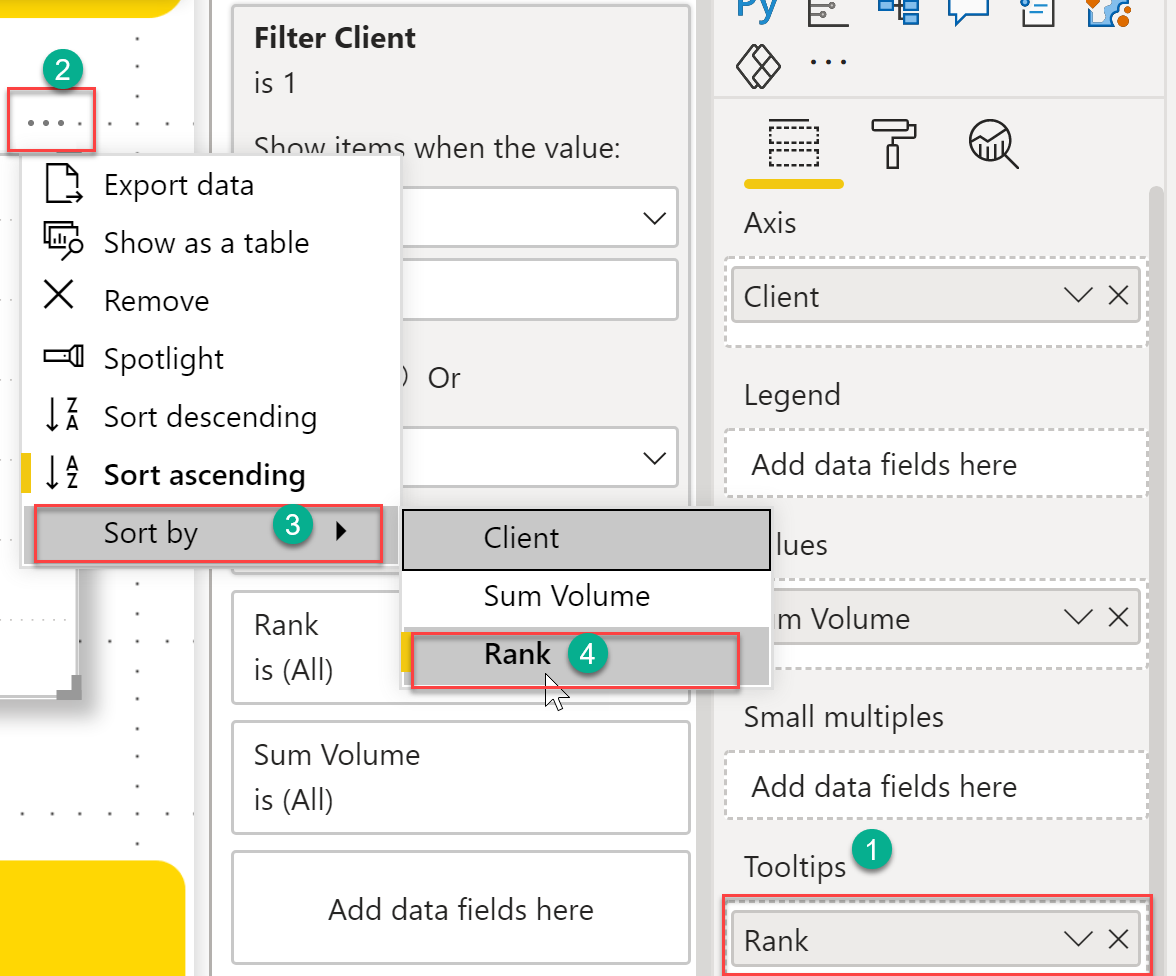
Now we can move on to the bonus for this solution. While we have solved the original question, you’ll notice in the above GIF that the visual is sorted by client, and not by rank. If you want the selected client to always be shown as the first bar in the visual, we just need to make use of the Rank measure that we have already created. Add the Rank measure on the tooltip, and then sort the visual by this measure. I actually didn’t know that it’s possible to sort by the tooltip measure until I worked on this solution!
And we now have the final solution in place, with the selected client always showing up as the first bar with the rest of the clients sorted by their rank based on volume.
I hope you have learned something new from this post, as I know I certainly did while working on the solution. Keep sharing, keep learning. 👍


No comment yet, add your voice below!